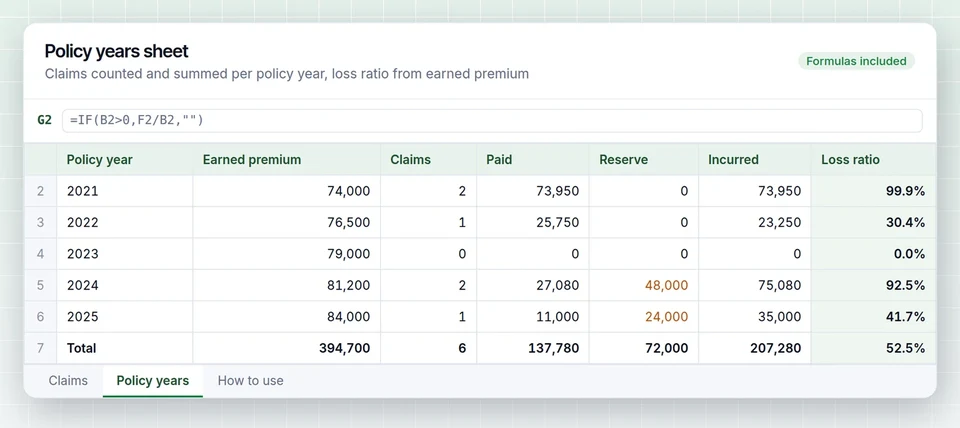

An insurance loss run template is a spreadsheet layout that puts claims from every carrier into the same columns: one row per claim, fixed fields for date of loss, status, paid, reserve and incurred, plus a summary tab that totals each policy year. It turns mixed carrier reports into one table an underwriter can read.
Brokers and account managers build these spreadsheets every renewal season, usually from scratch, and usually slightly differently each time. A consistent template saves hours per account and removes the most common errors, such as mixing loss and expense or counting a claim twice. This guide sets out the columns, formulas and checks that a good Excel loss run template needs, and you can download the same normalized layout from our insurance loss run template page.
Why carrier loss runs need a template
Each carrier designs its own loss run. One shows indemnity and expense separately, another combines them. One lists every feature of an auto claim on its own line, another rolls them into a single claim. One labels the reserve "outstanding", another "case reserve". When an account has five years of history across three carriers, you cannot add the reports together until they speak the same language. The template is that language.
If you are new to the fields themselves, read what a loss run report is and how to read one first.
The claims tab
The core of the workbook is a single claims table. Use an Excel Table (Insert, Table) so formulas and filters extend automatically when you paste in new rows.
| Column | Format | Notes |
|---|---|---|
| Carrier | Text | Use one spelling per carrier, ideally from a list |
| Policy number | Text | Store as text so leading zeros survive |
| Line of coverage | List | GL, Auto, WC, Property, Umbrella, Other |
| Policy effective date | Date | Start of the term the claim belongs to |
| Policy year | Formula | Derived from effective date, used for the summary |
| Claim number | Text | Carrier's reference |
| Date of loss | Date | Must fall inside the policy term |
| Date reported | Date | Optional but useful for reporting lag |
| Description | Text | Short cause of loss |
| Status | List | Open, Closed, Reopened, Closed without payment |
| Paid loss | Currency | Indemnity or loss payments only |
| Paid expense | Currency | ALAE paid, kept separate |
| Loss reserve | Currency | Outstanding indemnity |
| Expense reserve | Currency | Outstanding expense |
| Recoveries | Currency | Subrogation and salvage, entered as a positive number |
| Total incurred | Formula | Paid loss plus paid expense plus both reserves minus recoveries |
| Valuation date | Date | Date the carrier ran the report |
| Source file | Text | File name of the carrier report, for audit |
Formulas for the derived columns
With an Excel Table named Claims, the derived columns are simple structured references.
- Policy year.
=YEAR([@[Policy effective date]]). If your terms do not start on January 1, this still groups each term under the year it began, which is how most summaries present it. - Total incurred.
=[@[Paid loss]]+[@[Paid expense]]+[@[Loss reserve]]+[@[Expense reserve]]-[@Recoveries]. - Days to report.
=[@[Date reported]]-[@[Date of loss]], formatted as a number. - Large loss flag.
=IF([@[Total incurred]]>=25000,"Large",""), with the threshold in a named cell so you can change it per line.
Some markets want incurred without expense. Keep the components separate and you can produce either view without re-keying anything.
The summary tab
Underwriters read the summary before they look at a single claim. The standard layout is one row per policy year with premium, claim counts, incurred losses and loss ratio.
| Policy year | Earned premium | Claims | Open | Paid | Reserve | Incurred | Loss ratio |
|---|---|---|---|---|---|---|---|
| 2021 | $48,000 | 2 | 0 | $9,300 | $0 | $9,300 | 19.4% |
| 2022 | $51,500 | 3 | 0 | $22,100 | $0 | $22,100 | 42.9% |
| 2023 | $54,000 | 1 | 0 | $4,800 | $0 | $4,800 | 8.9% |
| 2024 | $57,200 | 4 | 1 | $18,600 | $12,000 | $30,600 | 53.5% |
| 2025 | $60,000 | 2 | 2 | $3,100 | $15,400 | $18,500 | 30.8% |
| Total | $270,700 | 12 | 3 | $57,900 | $27,400 | $85,300 | 31.5% |
The figures above are for a fictional account, Bluestem Millwork Inc. Build each cell with SUMIFS and COUNTIFS against the claims table, for example =SUMIFS(Claims[Total incurred],Claims[Policy year],A2). Earned premium comes from the policy records, not the loss run, so it has its own input column. The full method, including how to handle a partial current term, is in how to calculate loss ratio from loss runs.
Checks that belong in every template
A template that only adds numbers will add wrong numbers just as confidently. Build these checks into a third tab and look at it before anything goes to market.
- Reconciliation to carrier totals. For each source file, enter the carrier's printed total incurred and compare with
SUMIFSon that source. Any difference means a row was missed or keyed wrong. - Duplicate claim numbers.
=COUNTIFS(Claims[Carrier],[@Carrier],Claims[Claim number],[@[Claim number]])>1highlights claims that appear twice, often because two overlapping reports were pasted in. - Missing policy years. List the years you expect and count claims or no-loss confirmations for each. A year with zero rows and no confirmation is a gap, not a clean year.
- Stale valuations.
=TODAY()-[@[Valuation date]]>90flags reports older than 90 days. See currently valued loss runs. - Date of loss outside the term. A claim dated before the effective date usually means it was pasted under the wrong policy.
Keying tips that save time
- Paste carrier spreadsheets as values, then map columns, rather than retyping.
- For PDFs, keep the original file name in the source column so anyone can trace a number back.
- Enter one row per claim, not one per feature, unless the market asks for feature detail. Sum the features first.
- Use data validation lists for carrier, line and status so filters and summaries do not break on spelling.
- Never overwrite an older valuation. Add the new report as new rows with its own valuation date and filter to the latest.
Adapting the template by line of coverage
The claims tab above works for every line, but a few lines need extra columns so the summary answers the questions underwriters actually ask.
| Line | Extra columns | Why |
|---|---|---|
| Workers compensation | Claim type (medical only or lost time), medical paid, indemnity paid, injury type, class code | Lost time claims drive severity and feed the experience mod |
| Commercial auto | Feature (BI, PD, collision, comprehensive), driver, vehicle, at fault | Driver and fault patterns explain frequency |
| Property | Location number, cause of loss, building or contents | Ties losses to the statement of values |
| General liability | Coverage part (premises, products, completed operations) | Products and completed operations claims develop slowly |
For workers comp detail, our workers comp loss runs and experience mod guide explains how primary and excess losses are split.
Sharing the workbook with markets
Send the summary tab and the claims tab together, along with the original carrier reports. Underwriters trust a broker summary only when they can tie it back to the carrier's own document, so the source file column and the reconciliation tab do real work here. Lock the formula columns, remove internal notes, and save the workbook with the insured name and valuation date in the file name so a market never confuses two versions.
Where a spreadsheet stops scaling
A template works well for a handful of accounts. At renewal volume the time goes into keying scanned PDFs, chasing the carriers that have not sent anything, and re-checking totals. That is the part our loss run software automates. It reads PDF, scanned, XLSX and CSV loss runs into this same normalized schema, reconciles each report against its printed totals, flags gaps, duplicates and stale valuations, and builds the five-year summary with loss ratio. The output exports to Excel in the template layout, so the workbook your team already uses stays the deliverable.
You can try it on one of your own reports by choosing analyze a loss run on the homepage. For the next step after the summary, see our guide to loss run analysis.
Summary
- One claims table, one row per claim, fixed columns for loss and expense, paid and reserve.
- Total incurred is a formula, never a typed number.
- Summary by policy year with earned premium and loss ratio.
- Reconcile to carrier totals, check duplicates, missing years and valuation age every time.