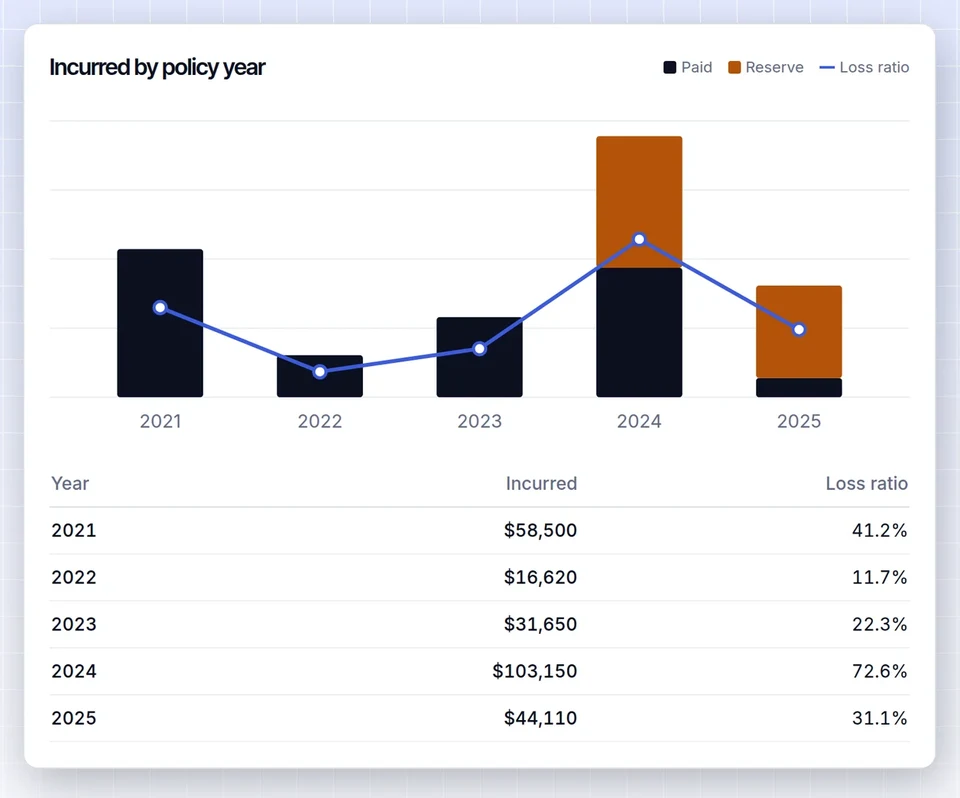

To calculate loss ratio from loss runs, add up incurred losses (paid plus reserves) for a policy period from the loss runs, divide by the earned premium for the same period, and multiply by 100. Do it for each policy year and for the full five-year period, using currently valued reports and matching premium to the same terms.
Loss ratio is the first number most underwriters look at on a commercial submission, and it is easy to get wrong. The formula is simple. The errors come from mismatched periods, written premium instead of earned, mixing loss and expense inconsistently, and stale valuations. This guide walks through the calculation with a full worked example and the adjustments underwriters commonly make.
The loss ratio formula
The basic formula is:
Loss ratio = incurred losses / earned premium
- Incurred losses come from the loss runs. For each claim, incurred equals paid plus outstanding reserve, minus any recoveries. Add all claims for the policy period.
- Earned premium comes from the policy records, not the loss run. It is the portion of premium that corresponds to coverage already provided. For a completed annual term, earned premium is the full premium after audit. For the current term, it is the share of the year that has passed.
Some loss runs print premium alongside losses, and some even print a loss ratio. Check both against the policy records, since carrier-printed premium is sometimes written rather than earned, or pre-audit.
Step by step
- Collect currently valued loss runs for every term in the period, usually five years plus current. See currently valued loss runs for why the valuation date matters.
- Normalize the claims into one table with paid, reserve and incurred in the same columns for every carrier. The Excel loss run template shows the layout.
- Decide on expense. Either include allocated expense (ALAE) in incurred for every carrier or exclude it for every carrier. Say which in the summary.
- Total incurred by policy year. Assign each claim to the term its date of loss falls in.
- Get earned premium by policy year from declarations and audit statements.
- Divide and format as a percentage per year and for the total period.
A worked example
Tamarack Supply Co. is a fictional wholesale distributor with a commercial package policy. Its loss runs, all valued within 45 days of the submission, give these totals.
| Policy year | Earned premium | Incurred losses | Loss ratio |
|---|---|---|---|
| 2021 | $82,000 | $31,160 | 38.0% |
| 2022 | $86,500 | $12,975 | 15.0% |
| 2023 | $91,000 | $74,620 | 82.0% |
| 2024 | $95,000 | $28,500 | 30.0% |
| 2025 | $99,000 | $22,770 | 23.0% |
| Five-year total | $453,500 | $170,025 | 37.5% |
For 2023, the calculation is $74,620 divided by $91,000, which is 0.820, or 82.0 percent. For the five-year period, $170,025 divided by $453,500 is 0.375, or 37.5 percent.
Do not average the yearly ratios
A common shortcut is to average the five annual loss ratios. Here that gives (38.0 + 15.0 + 82.0 + 30.0 + 23.0) / 5 = 37.6 percent, close to the right answer only because premium grew slowly. When premium changes a lot from year to year, a simple average gives a small year the same weight as a large one and can be badly off. Always divide total incurred by total earned premium.
The current partial year
Tamarack's current term has an annual premium of $104,000 and is six months old, so earned premium is about $52,000. Incurred losses so far are $9,880, a loss ratio of 19.0 percent. Show the current term on its own line rather than adding it into the five-year total. A partial year is immature: claims for the most recent months may not be reported yet, and reserves on new claims are often set low at first.
Adjustments underwriters make
The raw loss ratio is a starting point. Underwriters often adjust it, and a broker who anticipates the adjustments presents the account better.
Capping large losses
Tamarack's 2023 year includes a single products claim incurred at $60,000. Some underwriters cap individual claims at a threshold, for example $25,000, to see the underlying frequency. Capping the 2023 claim at $25,000 removes $35,000 from incurred.
| View | 2023 incurred | 2023 loss ratio | Five-year loss ratio |
|---|---|---|---|
| Uncapped | $74,620 | 82.0% | 37.5% |
| Large loss capped at $25,000 | $39,620 | 43.5% | 29.8% |
Showing both views, with a short explanation of the large claim and what the insured changed afterwards, is usually more persuasive than either number alone.
Loss development
Recent years are less mature than old ones, so their incurred losses tend to grow as claims develop. Actuarial pricing applies loss development factors to bring each year to an estimated ultimate value. Brokers rarely calculate these, but it helps to know that an underwriter may view a low loss ratio in the most recent full year with some caution.
Premium on a consistent basis
If rates changed significantly over the period, some underwriters restate older premium at current rate levels. A year with a low loss ratio at an old, low rate may look different at today's rates. Again, this is rarely the broker's calculation, but it explains why two people can quote different loss ratios for the same account.
Common mistakes
- Written premium instead of earned. Written premium on a policy that was cancelled or audited down overstates the denominator.
- Paid losses instead of incurred. Ignoring reserves makes recent years look far better than they are.
- Mismatched periods. Losses by calendar year and premium by policy year do not divide cleanly.
- Mixed expense treatment. One carrier's incurred includes ALAE and another's does not.
- Stale valuations. A report valued six months ago misses reserve changes. Flag any report older than 90 days.
- Missing years. A term with no loss run is not the same as a term with no losses.
Pair loss ratio with frequency
Loss ratio on its own hides how the losses happened. Two accounts can both run at 40 percent, one with a single large claim in five years and the other with thirty small ones. Underwriters treat those very differently, because many small claims usually point to an operational problem that will continue, while a single large claim may not repeat. Put claim count per year and average incurred per claim next to the loss ratio in every summary. If premium grew because the business grew, frequency per million of revenue or per hundred employees can be more telling than the raw count.
Loss ratio by line
On a multi-line account, calculate loss ratio per line as well as in total. A package with a clean property history and a poor auto history needs a different conversation than one where losses are spread evenly. For workers compensation, the experience mod is often more important than the loss ratio, as explained in workers comp loss runs and the experience mod.
Automating the calculation
The arithmetic takes a minute. Collecting, normalizing and checking five years of loss runs from several carriers takes hours. Our loss run software reads PDF, scanned, XLSX and CSV loss runs into one claims schema, reconciles each report against its printed totals, flags gaps, duplicates and stale valuations, and builds the five-year summary with loss ratio by policy year. You enter earned premium once per term and the summary updates. More on the review that follows is in loss run analysis, and plan options are on the pricing page.
Summary
- Loss ratio equals incurred losses divided by earned premium for the same period.
- Use incurred (paid plus reserve), not paid.
- Calculate per policy year and for the five-year total; never average the yearly ratios.
- Show the current partial term separately.
- Present large loss capped views when one claim distorts the picture.