Analysis
Loss run analysis, step by step
Loss run analysis turns five years of carrier claim history into the numbers an underwriter prices on: claim frequency, average severity, loss ratio against earned premium, large losses and open reserves. It shows whether losses are random or a trend, and what the insured has done to correct them.
What underwriters read first
Each one answers a different question about the account. Together they decide whether a market quotes, and at what rate.
Frequency
Number of claims per policy year. Frequency predicts future losses better than any single large claim, because it reflects day-to-day operations and safety culture.
Severity
Average incurred per claim. Rising severity with flat frequency often points to one exposure, such as a heavier vehicle class or a new jobsite type.
Loss ratio
Incurred losses divided by earned premium for the same period. It is the single number most markets compare against their target.
Large losses
Claims above a threshold, often $25,000 or $50,000 for small commercial. They are reviewed one by one with a narrative, then often excluded to show the underlying trend.
Open reserves
Money still expected to be paid on open claims. High open reserves on recent years mean the loss ratio can still move, usually upward.
Valuation age
How current the figures are. Reports older than 90 days are often rejected, because reserves on open claims may have changed.
A worked example with fictional numbers
A regional freight company with commercial auto only. Five policy years, earned premium of about $186,000 a year, large loss threshold $50,000.
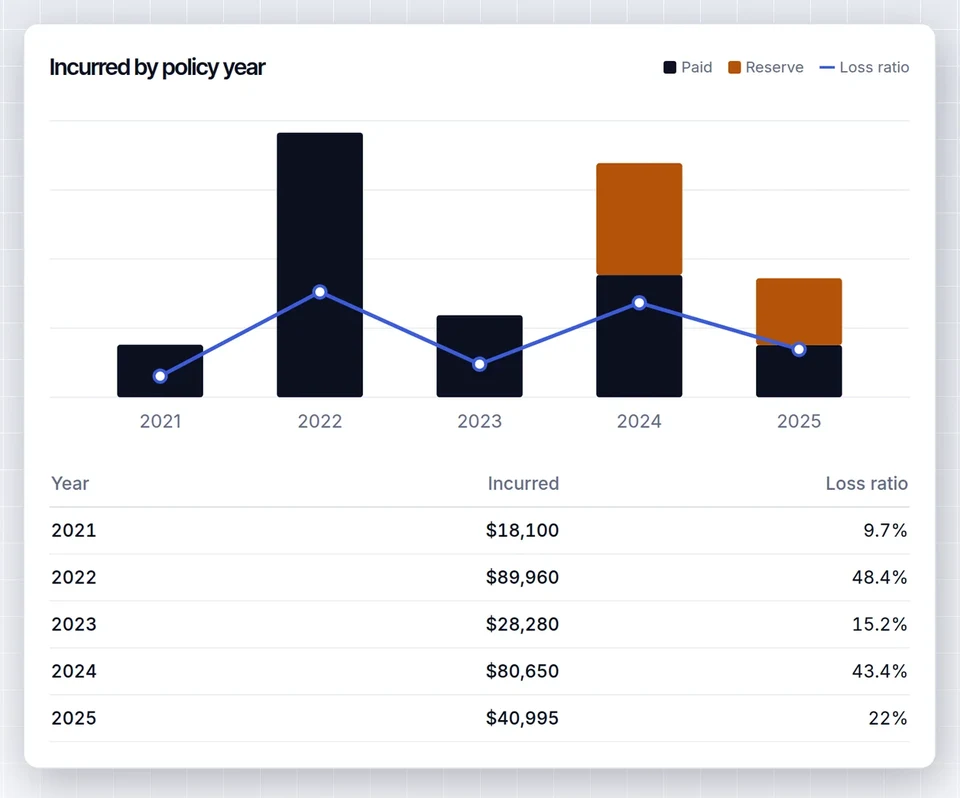
| Policy year | Earned premium | Claims | Incurred | Open reserves | Large losses | Loss ratio |
|---|---|---|---|---|---|---|
| 2021 | $186,000 | 2 | $18,100 | $0 | 0 | 9.7% |
| 2022 | $185,900 | 3 | $89,960 | $0 | 1 | 48.4% |
| 2023 | $186,000 | 2 | $28,280 | $0 | 0 | 15.2% |
| 2024 | $185,800 | 3 | $80,650 | $38,500 | 1 | 43.4% |
| 2025 | $186,300 | 2 | $40,995 | $23,000 | 0 | 22.0% |
| Five years | $930,000 | 12 | $257,985 | $61,500 | 2 | 27.7% |
Reading the example
Frequency is 12 claims over 5 years, or 2.4 a year, and it is flat. No single year jumps. That is a good sign for a fleet.
Severity averages $257,985 divided by 12, about $21,500 per claim. Without the two large losses, the other 10 claims average about $9,800.
Loss ratio over five years is $257,985 divided by $930,000, or 27.7 percent. Two years sit above 40 percent, each because of one large loss.
Large losses total $160,000, a closed $82,900 claim in 2022 and an open $77,100 claim in 2024. Excluding them, the loss ratio drops to about 10.5 percent. The narrative should explain both and what changed afterwards, for example driver training or telematics.
Open reserves of $61,500 sit entirely in 2024 and 2025. Those two years can still develop, which an underwriter will factor in.
5-yr loss ratio
27.7%
Frequency
2.4 / yr
Open reserves
$61,500
Where analysis goes wrong
Stale valuations
Comparing a 2023 report valued last year with a 2025 report valued last week understates older reserves. Ask for currently valued reports for every year.
Mixed incurred definitions
Some carriers include expense in incurred and some do not. Normalize first, or loss ratios across years and carriers are not comparable.
Double counted claims
A claim reported by two carriers after a mid-term change inflates frequency. Match by date of loss and claimant before counting.
Written instead of earned premium
Loss ratio uses earned premium for the same period as the losses. Written premium on a short or cancelled term gives the wrong answer.
LossRunReports normalizes every carrier report into one claims table first, reconciles it against the printed totals, then calculates the summary above automatically. The columns are explained on the insurance loss run template page, and the finished summary drops straight into a commercial insurance submission.
Writing the narrative
Numbers start the conversation. The narrative is what the underwriter quotes from in the referral.
A good underwriter narrative is short and specific. For each large loss it states the date, what happened, the amount paid and reserved, and what the insured changed afterwards. For the trend it says whether frequency is rising, flat or falling and why. For open reserves it says which claims are still open and what is expected.
In the example above, a strong narrative would say that the 2022 loss was a single at-fault collision that closed for $82,900, that the insured added forward-facing cameras and a driver training program in 2023, and that frequency stayed flat at two to three claims a year while the fleet grew. The 2024 open claim would be described with its current reserve and expected closing.
Avoid vague comfort language. Underwriters discount phrases like "safety is our top priority" and look for dates, amounts and actions.
Loss run analysis questions
What is a good loss ratio for a commercial account?
It depends on the line and the market. Many commercial markets target loss ratios well below 60 percent so premium also covers expenses and profit. Compare against the specific market rather than a general rule.
Should large losses be excluded from the analysis?
Show both. Present the full figures, then the figures excluding large losses with a narrative for each one. Hiding them loses credibility with the underwriter.
How many years should the analysis cover?
Five policy years plus the current term is the standard for most commercial lines. Three years can work for small accounts or new businesses.
Where does earned premium come from?
From the expiring policies, the AMS or the carrier statements. LossRunReports imports it per policy term for loss ratio on the Agency and Enterprise plans.
Can the narrative be written automatically?
LossRunReports drafts an underwriter narrative from the claims, covering large losses, trends and open reserves, and your producer edits it before it goes out.
See your own loss run read in under a minute
Upload one carrier report or use our sample. No account needed for the first read.